Meaning of following code:
//@version=4
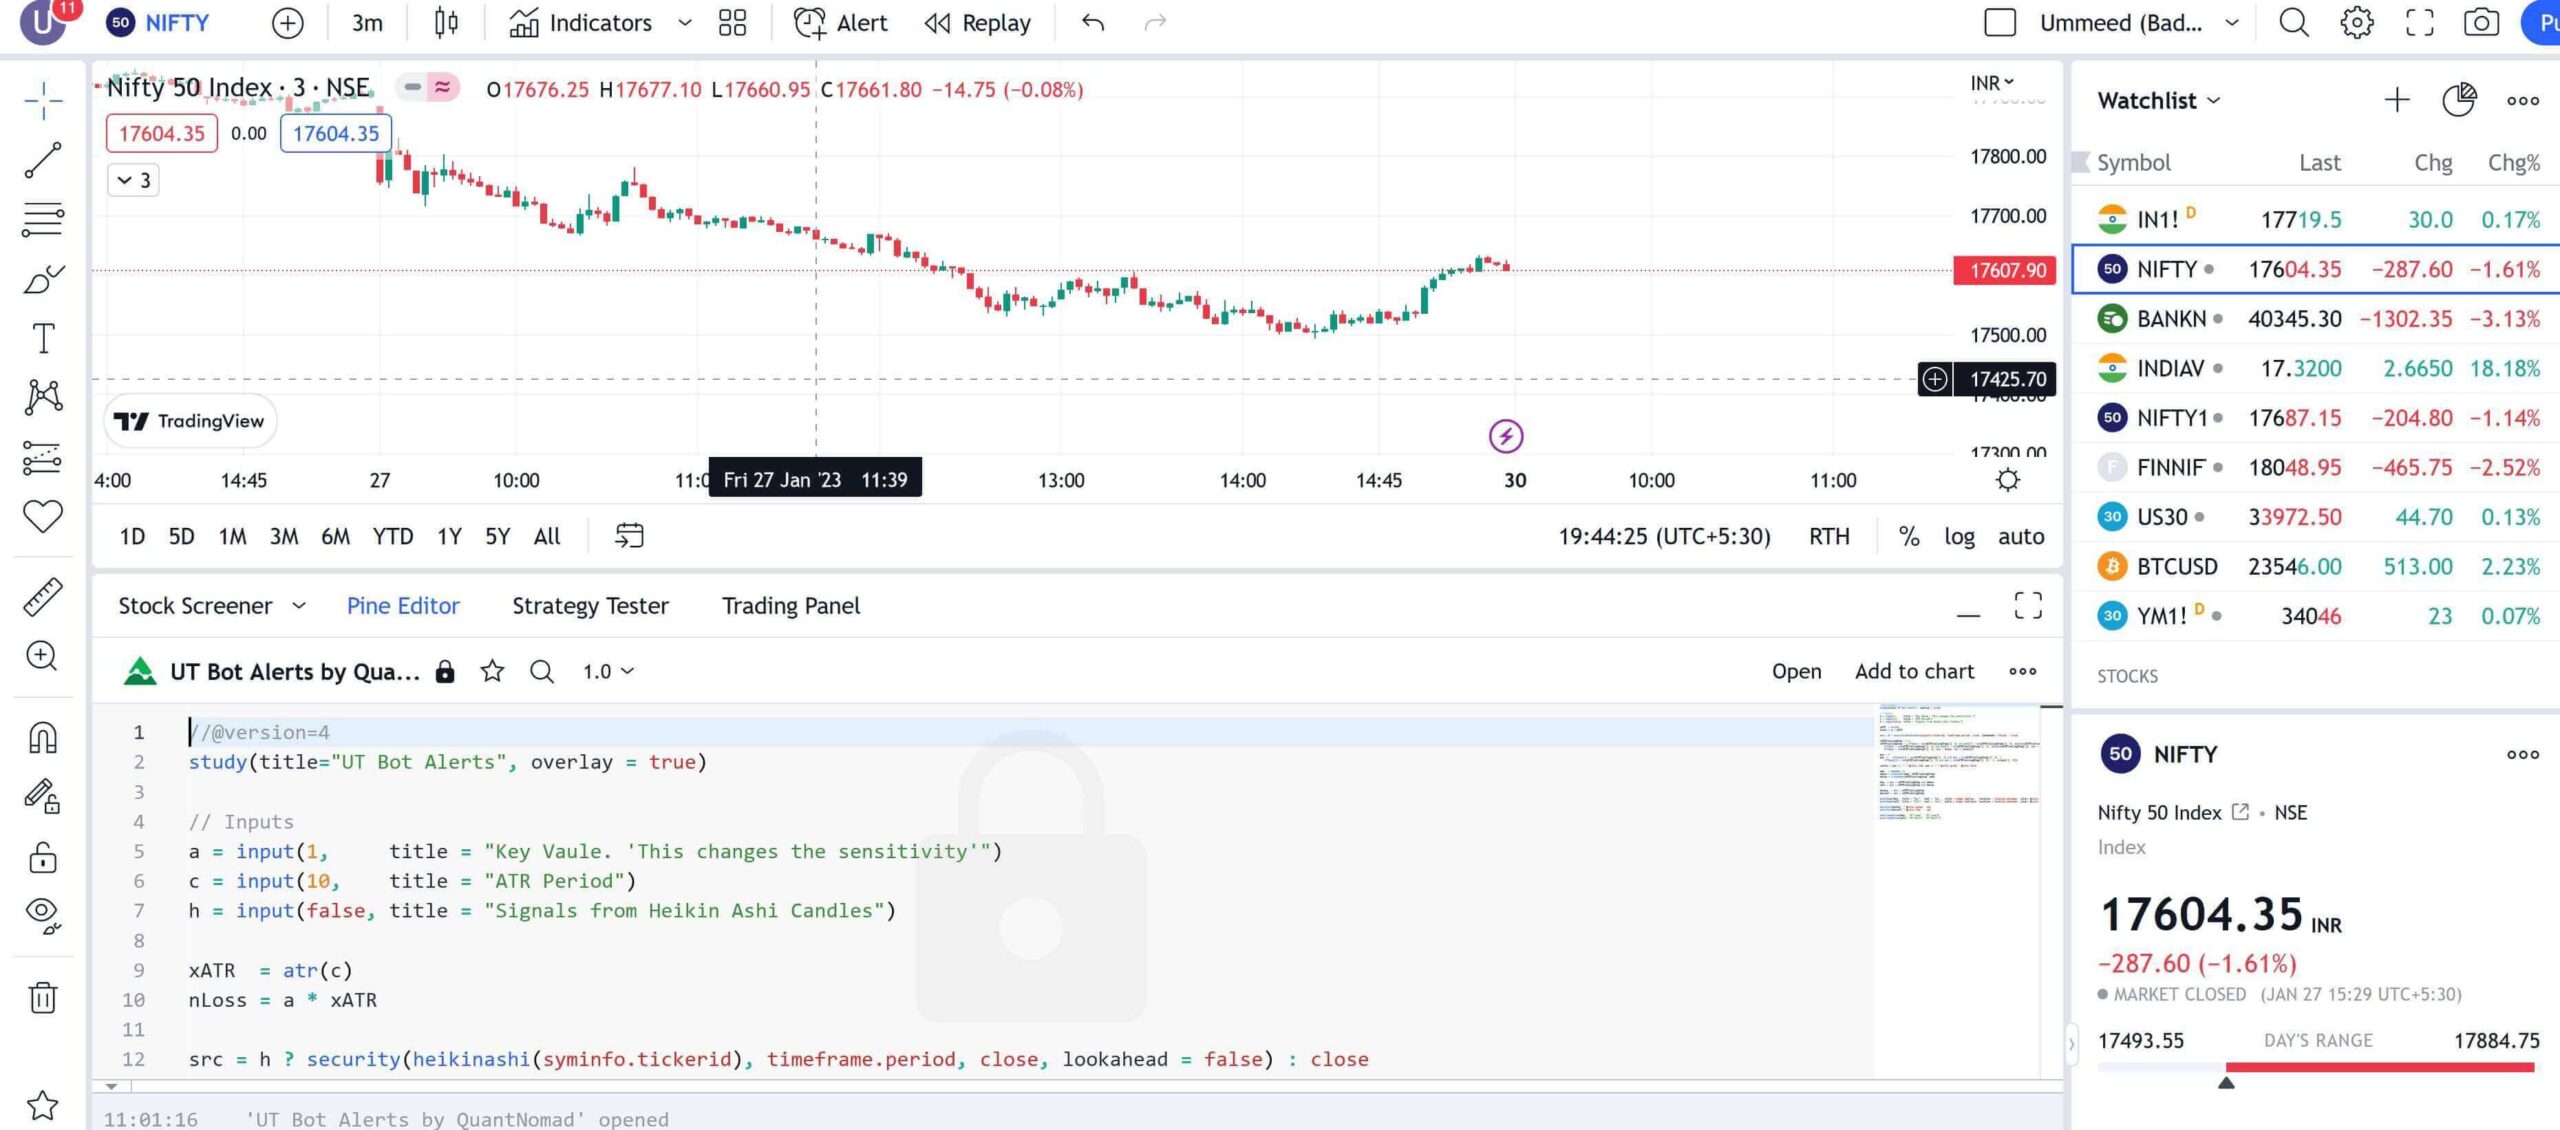
study(title=”UT Bot Alerts”, overlay = true)
// Inputs
a = input(1, title = “Key Vaule. ‘This changes the sensitivity'”)
c = input(10, title = “ATR Period”)
h = input(false, title = “Signals from Heikin Ashi Candles”)
xATR = atr(c)
nLoss = a * xATR
src = h ? security(heikinashi(syminfo.tickerid), timeframe.period, close, lookahead = false) : close
xATRTrailingStop = 0.0
xATRTrailingStop := iff(src > nz(xATRTrailingStop[1], 0) and src[1] > nz(xATRTrailingStop[1], 0), max(nz(xATRTrailingStop[1]), src – nLoss),
iff(src < nz(xATRTrailingStop[1], 0) and src[1] < nz(xATRTrailingStop[1], 0), min(nz(xATRTrailingStop[1]), src + nLoss), iff(src > nz(xATRTrailingStop[1], 0), src – nLoss, src + nLoss)))
pos = 0
pos := iff(src[1] < nz(xATRTrailingStop[1], 0) and src > nz(xATRTrailingStop[1], 0), 1,
iff(src[1] > nz(xATRTrailingStop[1], 0) and src < nz(xATRTrailingStop[1], 0), -1, nz(pos[1], 0)))
xcolor = pos == -1 ? color.red: pos == 1 ? color.green : color.blue
ema = ema(src,1)
above = crossover(ema, xATRTrailingStop)
below = crossover(xATRTrailingStop, ema)
buy = src > xATRTrailingStop and above
sell = src < xATRTrailingStop and below
barbuy = src > xATRTrailingStop
barsell = src < xATRTrailingStop
plotshape(buy, title = “Buy”, text = ‘Buy’, style = shape.labelup, location = location.belowbar, color= color.green, textcolor = color.white, transp = 0, size = size.tiny)
plotshape(sell, title = “Sell”, text = ‘Sell’, style = shape.labeldown, location = location.abovebar, color= color.red, textcolor = color.white, transp = 0, size = size.tiny)
barcolor(barbuy ? color.green : na)
barcolor(barsell ? color.red : na)
alertcondition(buy, “UT Long”, “UT Long”)
alertcondition(sell, “UT Short”, “UT Short”)
This code is written in Pine Script, a programming language used for creating trading strategies on the TradingView platform. It creates a study called “UT Bot Alerts” which is set to overlay on the chart and has various inputs for the user to adjust.
The code calculates the average true range (ATR) using the built-in atr() function and assigns it to the variable xATR, then it multiplies it by the user input a to create a new variable nLoss. Next, it checks whether the user wants to use Heikin Ashi candles or standard candles, then it assigns the appropriate type of candles to the variable src.
Next, the code calculates the ATR trailing stop using a combination of if statements and assigns the value to the variable xATRTrailingStop. It also calculates the position variable pos by checking whether the value of src has crossed above or below the ATR trailing stop.
The code then plots shapes on the chart to indicate buy and sell signals and changes the color of the bars to green for buy signals and red for sell signals. It also sets up alert conditions for when a buy or sell signal is triggered, with the alert message “UT Long” for buy signals and “UT Short” for sell signals.
Overall, the purpose of this code is to create a trading strategy that uses ATR and Heikin Ashi candles (if desired by user) to generate buy and sell signals with alert triggers, based on the user inputs of key value and ATR period.
More from my site
 WhatsApp will delete the account if you do not agree to the Terms & Conditions
- How to get Tradingview moving average script working?
- Linear Reg Forecast Strategies : Effective Stock Market Analysis
- Amazon Gift Card Promo Code Free | Log in to your Amazon account
- Florida cleaning systems | FCS Services
- Stochastic Oscillator Strategies : Effective Stock Market Analysis