Discover the hidden power of Volume Profiling techniques and revolutionize your trading strategy for maximum profit potential.
Greetings fellow traders and investors! Today, I am thrilled to embark on a journey that will unveil the secrets of volume profiling, a powerful tool that can revolutionize the way you navigate the financial markets. Whether you are a seasoned trader or just starting your investment journey, understanding volume profiling can significantly enhance your decision-making abilities.
Understanding Volume Profiling: An Overview
Before diving into the depths of volume profiling, let’s first establish a solid foundation by understanding its definition and conceptual framework. Volume profiling is a technique used to analyze market activity based on the volume traded at different price levels. By plotting these volumes on a price chart, we can gain insights into how the market behaves at specific price levels.
To comprehend volume profiling better, it’s essential to familiarize ourselves with key components and terminology. The two primary components are the volume profile itself, which displays the volume traded at each price level, and the value area, which represents the price range where the most significant volume is concentrated.
The Benefits of Volume Profiling
Now, let’s explore the significant advantages that volume profiling offers and why it has become a go-to tool for traders and investors.
Unveiling Market Activity and Participant Behavior
Volume profiling provides unique insights into market dynamics, allowing you to identify when and where markets are active. By understanding where buyers and sellers are most active, you can anticipate potential price movements and make more informed trading decisions.
Identifying Support and Resistance Levels
Volume profiling can help you identify significant support and resistance levels with remarkable precision. By analyzing volume distributions at different price levels, you can locate areas where buying or selling pressure is concentrated, creating reliable support and resistance zones.
Enhancing Risk Management Strategies
Volume profiling provides valuable information about liquidity and market depth, enabling you to effectively manage your risk exposure. By spotting areas of low liquidity or thin markets, you can adjust your position sizing and risk management strategies accordingly.
Uncovering Trends and Market Sentiment
Volume profiling can help you gain insights into market sentiment and identify potential trends before they fully develop. Changes in volume patterns can reveal shifts in market sentiment, allowing you to stay ahead of the curve and take advantage of emerging opportunities.
“Unlock the secrets of success in trading with Volume Profiling – a powerful tool that reveals hidden opportunities in the market. Master the art and revolutionize your trading game. [insert link] #trading #success”
Practical Applications and Strategies
Now that we understand the benefits of volume profiling, let’s explore some practical applications and strategies you can employ in your trading and investing endeavors.

Image courtesy of www.amazon.com · In stock via Google Images
Volume Profile Analysis in Day Trading
If you are a day trader, volume profiling can be a game-changer in identifying potential breakouts and confirming trade setups.
Identifying High Volume Zones for Potential Breakouts: By examining volume profiles, you can identify price levels where high volumes have transacted in the past. When the market retests these levels in the future, it often results in significant price movements or breakouts. These high-volume zones can serve as excellent entry or exit points.
Utilizing Volume Delta for Trade Confirmation: Volume delta, which measures the difference between buying and selling volume at each price level, can be used to confirm trade setups. When volume delta aligns with your desired trade direction, it provides additional conviction for your trades.
Swing Trading with Volume Profiles
For swing traders, volume profiling can help identify potential entry and exit points with greater accuracy.
Recognizing Volume Clusters for Entry and Exit Points: Volume clustering occurs at specific price levels where significant buying or selling activity has taken place. These clusters often act as magnets, attracting price towards them. By identifying volume clusters, you can enhance your timing for entering or exiting swing trades.
Using Volume Weighted Average Price (VWAP) as a Guide: VWAP is an essential tool for swing traders, as it provides a moving average based on both volume and price. It helps identify fair value areas and spots where aggressive buyers or sellers are present. Swing traders often use VWAP as a reference point for potential reversals or continuation of trends.
Long-Term Investing with Volume Profiles
Even long-term investors can benefit from volume profiling by using it to gain insights into institutional activity and potential trend reversals.
Identifying Institutional Accumulation or Distribution: Institutional investors often accumulate or distribute large positions over an extended period. This activity leaves footprints in volume profiles, allowing astute investors to take advantage of potential long-term trends by following in the footsteps of the big players.
Spotting Potential Trend Reversals with Volume Divergence: Volume divergence occurs when the price is moving in one direction, but the volume is moving in the opposite direction. This often signals exhaustion of the prevailing trend and the potential for a reversal. By analyzing volume divergence in volume profiles, long-term investors can make well-timed decisions and capture significant trend reversals.
Tools and Platforms for Volume Profiling
Now that you understand the power of volume profiling, you might be wondering which tools and platforms can support your journey.
Charting Software with Volume Profile Functionality: Many advanced charting platforms, such as TradingView, NinjaTrader, and Sierra Chart, offer built-in volume profiling functionality. These tools allow you to customize and display volume profiles directly on your charts.
Popular Volume Profiling Indicators and Tools: There are various indicators and tools designed explicitly for volume profiling, such as the Volume Profile Indicator, Market Profile Indicator, and Footprint Charts. These tools provide in-depth analysis of volume data and assist in identifying key points of interest.
Online Communities and Resources for Further Learning: To refine your volume profiling skills, engage with online communities and explore educational resources dedicated to this technique. Participating in forums, attending webinars, and reading insightful blogs and books can expand your knowledge base and accelerate your proficiency in volume profiling.
Challenges and Limitations
While volume profiling offers immense potential, it is crucial to be aware of its limitations.
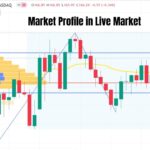
Image courtesy of www.fssi-splash.com via Google Images
Interpretational Challenges of Volume Profile: Interpreting volume profile charts requires experience and a deep understanding of market dynamics. It is essential to approach volume profiling as a complementary tool and combine it with other technical analysis techniques for confirmation and validation.
Instances of Misleading Volume Profiles: Occasionally, volume profiles may contain irregularities or “false prints” due to market anomalies, technical glitches, or low liquidity periods. Being aware of these instances will help you avoid making trading decisions based on inaccurate information.
Combining Volume Profiling with Other Analytical Tools: While volume profiling is a powerful tool, it is not meant to be used in isolation. Integrating it with other technical analysis tools, such as trend analysis, candlestick patterns, and oscillators, can provide a more comprehensive and reliable picture of market conditions.
How did Volume Profiling Gain Momentum?
Volume profiling gained momentum in the late 1990s and early 2000s, thanks in part to the work of traders such as Richard Wyckoff and Tom DeMark. Wyckoff and DeMark were both early proponents of volume profile analysis, and they helped to popularize the indicator among traders.
Why did Volume Profiling Gain International Traction?
Volume profiling gained international traction because it is a universal tool that can be applied to any market, regardless of asset class or location. Volume profiling can be used to trade stocks, bonds, currencies, commodities, and futures.
Examples of Volume Profiling in Table Format
| Market | Example |
|---|---|
| Stocks | A trader might use volume profiling to identify key support and resistance levels on a stock chart. The trader could then use these levels to place buy and sell orders. |
| Bonds | A trader might use volume profiling to identify areas of high buying or selling pressure on a bond chart. The trader could then use this information to make informed trading decisions. |
| Currencies | A trader might use volume profiling to identify key support and resistance levels on a currency chart. The trader could then use these levels to place buy and sell orders. |
| Commodities | A trader might use volume profiling to identify areas of high buying or selling pressure on a commodity chart. The trader could then use this information to make informed trading decisions. |
| Futures | A trader might use volume profiling to identify key support and resistance levels on a futures chart. The trader could then use these levels to place buy and sell orders. |
Conclusion: Powering Your Trading and Investing Journey with Volume Profiling
In conclusion, unlocking the secrets of volume profiling can significantly enhance your trading and investing journey. The benefits it offers, such as understanding market activity, identifying support and resistance levels, enhancing risk management, and uncovering trends, make it an indispensable tool for any trader or investor.
Imagine you are running a lemonade stand. At the end of each day, you track how many glasses of lemonade you sold at each price point. You then plot this information on a graph, with the price on the x-axis and the volume on the y-axis.
By incorporating volume profiling into your analysis toolbox and combining it with other technical analysis techniques, you can gain a deeper understanding of market behavior and make more informed decisions. Continuously improving your skills through online resources, staying updated with the latest developments, and honing your ability to interpret volume profiles will give you a competitive edge.
So, fellow traders and investors, embrace the power of volume profiling and unleash its potential to master the art of trading!
More from my site
 10 Best Stock Market Trading Books of All Time
- Grindwell Norton Share Price Live (2,093.00 INR): Investors Analysis
- Market Profile Trading Strategies: A Step-by-Step Overview
- Mastering Advance Option Chain Tool [AOC]: A Trader’s Key to Success
- How to Use Trailing Stop Loss in Zerodha? | Zerodha Mein SL (Stop Loss) Order Kaise Lagate Hai?
- Menara Trading Software: Algorithmic Trading for Professionals

![Mastering Advance Option Chain Tool [AOC]: A Trader’s Key to Success](https://seorub.com/wp-content/uploads/2023/07/A-trader-life-with-advance-option-chain-tool-AOC1-150x150.jpg)