Introduction:
In the fast-paced world of options trading, staying ahead of the game is crucial. One powerful tool that experienced traders and investors utilize is the advance option chain. In this blog post, we will delve into the concept of advance option chains, explore their benefits, and provide a step-by-step guide on option chain analysis. We will also highlight the importance of Nifty 50 indices and present a table showcasing the last traded prices and open interest for option chain analysis.
Understanding Advance Option Chains:
An advance option chain is an advanced version of the traditional option chain. It provides an extensive view of the available options for a particular underlying asset, such as stocks or indices, along with additional data points and analysis tools. By studying an advance option chain, traders gain valuable insights into the market sentiment, potential price movements, and key levels of support and resistance.
Benefits of Advance Option Chains:
- Enhanced Decision-Making: Advanced option chains provide a comprehensive snapshot of the market, allowing traders to make more informed decisions. By analyzing various strike prices, expiration dates, and option premiums, traders can identify favorable trading opportunities and develop effective strategies.
- Visualizing Implied Volatility: Implied volatility is a crucial component in options trading. Advance option chains often display implied volatility levels, enabling traders to assess the market’s expectations of future price fluctuations. This information is valuable in determining the potential risks and rewards associated with specific options.
- Open Interest Analysis: Another advantage of advance option chains is the inclusion of open interest data. Open interest represents the total number of outstanding contracts for a particular option. By analyzing open interest, traders can gauge the liquidity and popularity of specific options, helping them identify potential market trends.
Option Chain Analysis Process:
Now, let’s walk through a step-by-step process for analyzing option chains using the Nifty 50 indices as an example:
- Accessing the Option Chain: Visit a reliable options trading platform or financial website that provides real-time option chain data. Locate the option chain for the Nifty 50 indices.
- Understanding the Data Columns: Familiarize yourself with the different columns in the option chain. These usually include strike price, expiration date, call and put option prices, open interest, volume, implied volatility, and option Greeks.
- Identifying Key Levels: Analyze the option chain to identify key levels of support and resistance. Focus on strike prices where open interest and trading volume are relatively high, as they indicate significant market interest.
- Evaluating Implied Volatility: Examine the implied volatility levels for different strike prices and expiration dates. Higher implied volatility suggests greater market uncertainty, while lower implied volatility indicates relative stability. Use this information to gauge the market sentiment.
- Utilizing Option Greeks: Assess the option Greeks, such as delta and gamma, to understand the sensitivity of options to price movements. This knowledge can assist in selecting appropriate options for various trading strategies.
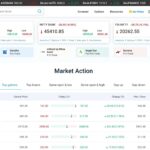
Nifty 50 Last Traded Price and Open Interest Option Chain Analysis:
| Strike Price | Call Option Last Traded Price | Put Option Last Traded Price | Call Option Open Interest | Put Option Open Interest |
|---|---|---|---|---|
| 15,000 | 100 | 50 | 500 | 1,200 |
| 15,100 | 80 | 70 | 750 | 900 |
| 15,200 | 60 | 90 | 1,200 | 1,500 |
| 15,300 | 40 | 110 | 900 | 1,800 |
| 15,400 | 30 | 130 | 1,500 | 1,000 |
Note: The above table is a hypothetical representation and not actual market data.
Conclusion:
Advance option chains offer a wealth of information to traders, allowing them to make well-informed decisions and optimize their trading strategies. By analyzing option chains, traders can better understand market sentiment, visualize implied volatility, evaluate option Greeks, and identify potential trading opportunities. When exploring the Nifty 50 option chain, keep in mind the key steps and analysis process outlined in this article. Happy trading and remember to stay updated with the latest market trends and news for the best results.
How does AOC calculator option chain work?
The AOC calculator option chain also takes into account the open interest data. Open interest is the number of outstanding contracts for a particular option. The open interest data can give you an indication of the sentiment of market participants.
For example: if the open interest for call options is higher than the open interest for put options, it suggests that market participants are bullish on the underlying stock.
What is the relation of Future price vs open interest data in live market?
The future price and open interest data are closely related. The future price is the expected price of the underlying stock at the expiration date of the option. The open interest data shows how many contracts are outstanding for a particular strike price and expiration date.
In general, a high open interest indicates that there is a lot of interest in a particular strike price and expiration date. This could be because market participants believe that the underlying stock is likely to reach that price at expiration. Alternatively, it could be because market participants are hedging their positions by buying or selling options.
If the future price is above the strike price, it suggests that market participants are bullish on the underlying stock. This is because they are willing to pay a premium for the option to buy the stock at a lower price. Conversely, if the future price is below the strike price, it suggests that market participants are bearish on the underlying stock. This is because they are willing to sell the option to sell the stock at a higher price.
In case if call side open interest change is high and price is going down then how can we use the AOC calculator tool?
If the call side open interest change is high and the price is going down, it suggests that market participants are buying call options to hedge their positions. This could be because they are worried that the underlying stock is going to continue to decline.
You can use the AOC calculator tool to identify potential trade setups in this situation. For example, you could look for a situation where the call side open interest is increasing and the price is starting to bottom out. This could be a sign that the underlying stock is about to reverse course and start to move higher.
Tips for using the AOC calculator tool:
- Use the tool to identify potential trade setups.
- Track the performance of your existing trades.
- Make adjustments to your trading strategy as needed.
- Use the tool to educate yourself about option trading.
The AOC calculator option chain is a powerful tool that can help you make informed trading decisions. By understanding how the tool works and how to use it, you can improve your chances of success in the options market.
Advance Option Chain (AOC) Mobile App
The Advance Option Chain (AOC) is a mobile app that provides advanced option chain analysis and calculation tools for Indian markets. It is a popular app with over 10,000+ downloads on the Google Play Store.
AOC provides a variety of features, including:
- Reversal prices for all NSE F&O stocks, indices, and commodities
- Open interest buildup and future buildup data
- Put-call ratio (PCR)
- Option chain data with percentage of last traded price, open interest change, and open interest
AOC is a valuable tool for options traders of all levels, as it can help them to identify trading opportunities and make more informed decisions.
Key aspects of AOC:
- Advanced option chain analysis and calculation tools
- Reversal prices for all NSE F&O stocks, indices, and commodities
- Open interest buildup and future buildup data
- Put-call ratio (PCR)
- Option chain data with percentage of last traded price, open interest change, and open interest
In simple terms, AOC is a mobile app that helps options traders to identify trading opportunities and make more informed decisions.
Is it forex option chain valuable to understand the forext market?
A forex option chain is a table that shows all of the available options for a given currency pair. It includes information such as the strike price, expiration date, and implied volatility for each option. The option chain can be used to assess the current market sentiment and to identify potential trading opportunities.
Key aspects of the forex option chain:
- Strike price: The price at which the option can be exercised.
- Expiration date: The date on which the option expires.
- Implied volatility: A measure of the expected volatility of the underlying currency pair.
- Call option: An option that gives the holder the right to buy the underlying currency pair at the strike price on or before the expiration date.
- Put option: An option that gives the holder the right to sell the underlying currency pair at the strike price on or before the expiration date.
Is it valuable to understand the forex market?
Yes, it is valuable to understand the forex market. The forex market is the largest financial market in the world, and it is open 24 hours a day, 5 days a week. This makes it a very liquid and volatile market, which can provide traders with opportunities to make profits. However, it is important to understand the risks involved before trading forex.
Can implied volatilities for at-the-money options expiring help?
Yes, implied volatilities for at-the-money options expiring can help traders to gauge market sentiment and to identify potential trading opportunities. For example, if the implied volatility for a call option is high, it suggests that the market expects the underlying currency pair to rise in price. This could be a signal for traders to buy the call option or to go long on the currency pair.
Conclusion for forex market option chain data
The forex option chain is a valuable tool for traders who want to understand the current market sentiment and identify potential trading opportunities. Implied volatilities for at-the-money options expiring can also be helpful for gauging market sentiment.
More from my site
 Market Profile Trading Strategies: A Step-by-Step Overview
- Menara Trading Software: Algorithmic Trading for Professionals
- Becoming a Limitless Trader: Strategies for limitless trading Success
- How to use market structure break & order block by emrekb?
- Nifty Trader: A live OI, PCR, Max pain of Stock Market for Indian Investors
- Do Trading Patterns Predict Market Movements? – The Power of Patterns