1. Understanding the Market Profile:
- Analogy: Think of the market as a landscape, and each day’s trading activity as a unique terrain. The market profile is like a topographic map, providing a graphical representation of price and volume over time.
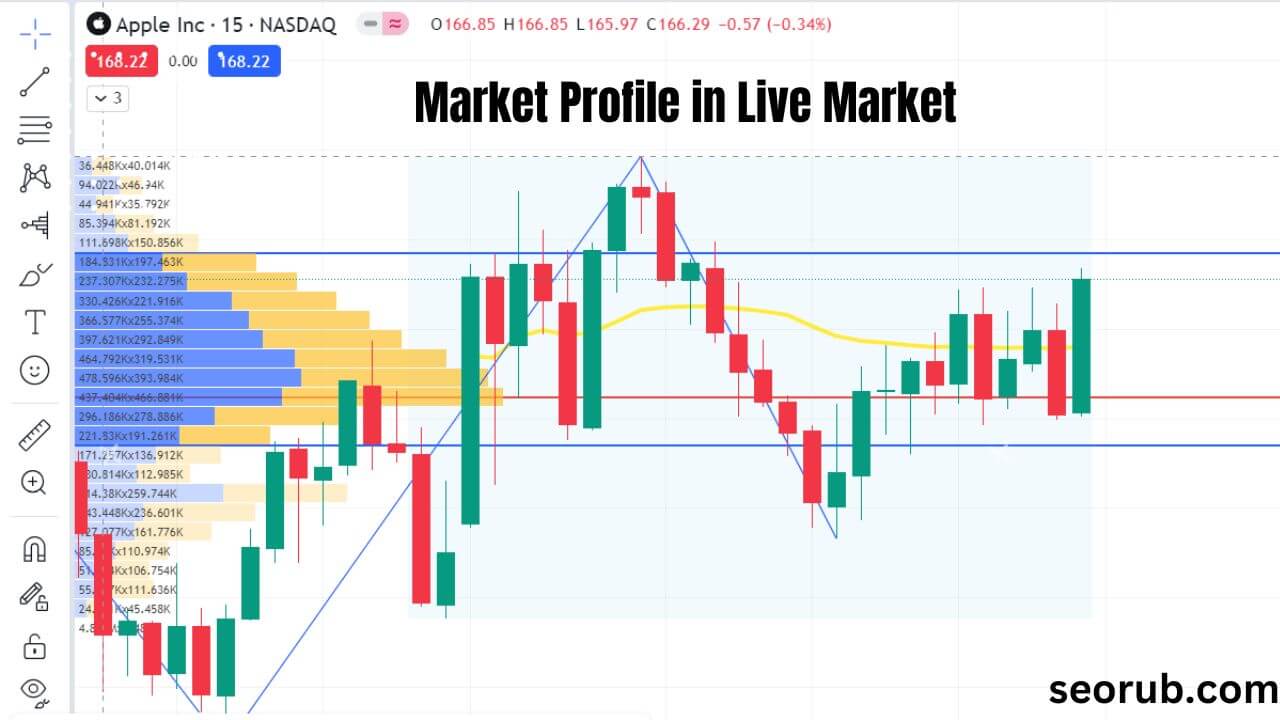
- Starting Point: Begin by looking at a market profile chart, which consists of vertical bars representing the price distribution during a specific time period.
2. Key Components of Market Profile:
- Point of Control (POC): The price level with the most time spent during the trading session.
- Value Area: The range of prices where a significant portion of trading occurs (usually 70-80%).
- High and Low: The highest and lowest prices during the session.

3. Daily Preparation:
- Analogous to Weather Forecasting: Just as a meteorologist studies atmospheric conditions, a trader analyzes the previous day’s market profile to forecast potential price movements.
- Identify Key Levels: Determine support and resistance levels based on the POC, value area, and high/low prices.
4. Opening Auction:
- Market Open as the Bell Rings: Picture the market opening as an auction. Buyers and sellers interact, setting the initial price.
- Observing Initial Balance: The first hour often sets the tone for the day. Monitor how prices behave during this “auction” phase.

5. Developing Market Profile Throughout the Day:
- TPOs (Time Price Opportunities): Track how prices move over time. Each letter in the profile represents a 30-minute time period.
- Volume Analysis: Consider the volume at different price levels. High-volume nodes indicate significant trading activity.
6. Midday Assessment:
- Analogous to Halftime Analysis in Sports: Take a midday break to assess how the market has developed. Identify any emerging patterns or trends.
- Volume Surge Detection: Look for sudden increases in volume, signaling potential strong movements.
7. Afternoon Session and Closing Auction:
- Market as a Closing Auction: The final hours are another auction, determining the closing price. Observe how the market behaves in this crucial phase.
- Closing Price Impact: Note the closing price’s relation to the POC and value area. A close outside the value area may indicate a shift in market sentiment.
8. Post-Market Analysis:
- Review and Learn: After the market closes, analyze the day’s profile. Compare predictions to actual outcomes. Identify areas for improvement in forecasting.
9. Longer-Term Strategies:
- Weekly and Monthly Profiles: Extend the analysis to longer timeframes for a comprehensive view. Weekly and monthly profiles provide insights into broader market trends.
10. Risk Management:
- Stop-Loss as an Emergency Exit: Implement stop-loss orders based on critical market profile levels to manage risk. Just as a fire exit plan is crucial for safety, a well-defined exit strategy is vital for traders.
Analogy:
Imagine that you are at an auction for a painting. The auctioneer starts the bidding at $100, and there are several bidders interested in the painting. The bidding quickly goes up to $200, and then there is a pause. This pause is similar to the initial balance in market profile. It represents a price level where buyers and sellers are in balance.
The bidding then resumes, and the price goes up to $250. At this point, there is a large amount of buying interest, and the price quickly goes up to $300. This is similar to an auction imbalance in market profile. It represents a price level where there is more buying pressure than selling pressure.
The painting is eventually sold for $300. This is similar to a breakout in market profile. It represents a price level where buyers were able to overcome the selling pressure and push the price higher.
Example:
A market profile trader might look to buy a stock if it breaks out above the auction imbalance high. They might also look to sell a stock if it breaks out below the auction imbalance low.
Here are some additional tips for using market profile trading strategies:
- Use market profile charts to identify the value area, initial balance, and auction imbalances.
- Look for trading opportunities at key price levels, such as the POC, the initial balance, and the auction imbalance highs and lows.
- Use other technical analysis tools, such as price action and candlestick patterns, to confirm your trades.
- Risk manage your trades by using stop-loss orders.
Please note that market profile trading is not a guaranteed way to make money. It is important to do your own research and develop a trading plan before using any trading strategy.
Conclusion:
Market profile trading is akin to studying and navigating through dynamic landscapes. Each day presents a new topography, and a trader equipped with the tools of market profile analysis can make informed decisions based on the nuances of the market’s terrain. Just as a seasoned explorer understands the lay of the land, a skilled trader navigates the market profile to uncover opportunities and manage risks effectively.
More from my site
![Mastering Advance Option Chain Tool [AOC]: A Trader’s Key to Success](data:image/gif;base64,R0lGODlhAQABAAAAACH5BAEKAAEALAAAAAABAAEAAAICTAEAOw==) Mastering Advance Option Chain Tool [AOC]: A Trader’s Key to Success
Mastering Advance Option Chain Tool [AOC]: A Trader’s Key to Success- Menara Trading Software: Algorithmic Trading for Professionals
- Becoming a Limitless Trader: Strategies for limitless trading Success
- How to use market structure break & order block by emrekb?
- Nifty Trader: A live OI, PCR, Max pain of Stock Market for Indian Investors
- Do Trading Patterns Predict Market Movements? – The Power of Patterns
![Mastering Advance Option Chain Tool [AOC]: A Trader’s Key to Success](https://seorub.com/wp-content/uploads/2023/07/A-trader-life-with-advance-option-chain-tool-AOC1-150x150.jpg)