Bullish Candlestick chart patterns are a type of technical analysis used by traders to help identify potential buying and selling opportunities in the stock market. Bullish reversal patterns can be identified by specific characteristics in the formation of a candle on a candlestick chart. Some of the most common bullish candlestick patterns include the hammer, the morning star, and the bullish engulfing pattern.
What are the best ways to trade?
The best bullish pattern is subjective and may depend on an individual trader‘s personal preferences and trading strategy. Some traders may prefer patterns that have a higher success rate, while others may prefer patterns that have more pronounced reversal signals.
In terms of strength, it is difficult to determine the single strongest candlestick pattern as the strength of a pattern can vary depending on market conditions and the specific stock being traded. However, a strong bullish candle is generally characterized by a large real body that is colored green or white, and which is located near the top of the overall price range for that period. This indicates that the stock’s price has risen significantly during the period and that bullish sentiment is strong.
To use candlestick charts for intraday trading, you need to understand how to interpret the patterns formed by the candles. Some basic concepts to keep in mind include the relationship between the open, high, low, and close prices, as well as the colors of the candles (green or white for bullish and red or black for bearish). It is also important to consider other technical indicators, such as moving averages and support and resistance levels, in conjunction with candlestick charts to develop a comprehensive trading strategy.
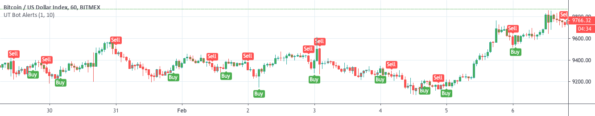
Intraday Candlestick Patterns are a powerful way to understand market trends. They can help you identify when a stock is about to go up or down, and they can provide a valuable insight into price movement. Here’s how to use Intraday Candlestick Patterns in your trading portfolio.

Intraday Patterns.
Intraday patterns are patterns that occur daily or very frequently. Intraday patterns are often used to predict stock prices.
How Can You Use Intraday Patterns.
Intraday patterns can be used to predict stock prices by using the information provided in the pattern and the current market conditions. Intraday patterns can also be used to identify areas of weakness or strength in the market.
What Are Some Intraday Patterns?
Some common intraday patterns include:
1) The V-shape: This pattern is typically seen during bull markets and indicates that stocks are rising in value.
2) The P-shape: This pattern is typically seen during bear markets and indicates that stocks are falling in value.
3) The R-shape: This pattern is typically seen during weak economic times and usually indicates that there is a trend of falling prices.
How to Find Intraday Patterns.
Intraday patterns are patterns that happen daily or almost every day. They can be found by looking at price data, or by using time-to-market data to find patterns.
To find Intraday patterns, you first need to identify the intraday periods. Intraday periods are the timespan during which prices are typically different than the average price. The average price is the average of the past 24 hours.
There are three types of intraday periods: short-term, medium-term, and long-term. A short-term intraday period is less than a day and a medium-term intraday period lasts for more than 12 days. A long-term intraday period lasts for more than 365 days.
To find Intraday patterns by looking at price data, look at each individualday’s prices and see if there is a pattern emerging. For example, if you notice that the average price for gasoline yesterday was $3.68, then you can assume that there will be an increase in gasoline prices today because it’s an Intrade day.
If you’re interested in finding Intrade patterns by using time-to-market data, look at past sales data and see if there are any interesting trends emerging. For example, if you look at historical gas prices from Phillips 66 oil companies in North America, you’ll likely see an increase in gas prices when demand increases around international events like presidential summits or large sporting events (like Super Bowls).
How to Use Intraday Patterns.
Intraday patterns are a type of trading signal that can be used to make trading decisions. Intraday patterns are useful for making buying and selling decisions based on the current market conditions.
To use an intraday pattern, you need to find the presumptive support or resistance level at which the price is expected to move next. You need to identify the time frame within which this area will be seen and then use this information to make trading decisions.
To use an intraday pattern, you first need to find the presumptive support or resistance level at which the price is expected to move next. You can do this by following some basic steps:
1) Identify the time frame within which this area will be seen;
2) Use this information to make trading decisions;
3) Be sure that you have a good understanding of how markets work and how they respond to changes;
4) Be prepared to make adjusted trades in response to sudden changes in market conditions.
Conclusion
Intraday patterns are patterns that happen in the market during specific periods of time. By looking at price patterns and using time-to-market data, you can find Intraday Patterns. These patterns can help you make trading fixtures, get ahead of your competition, or get the most out of your trading Willems.
More from my site
 Market Profile Trading Strategies: A Step-by-Step Overview
- Mastering Advance Option Chain Tool [AOC]: A Trader’s Key to Success
- Menara Trading Software: Algorithmic Trading for Professionals
- Becoming a Limitless Trader: Strategies for limitless trading Success
- How to use market structure break & order block by emrekb?
- Nifty Trader: A live OI, PCR, Max pain of Stock Market for Indian Investors
![Mastering Advance Option Chain Tool [AOC]: A Trader’s Key to Success](https://seorub.com/wp-content/uploads/2023/07/A-trader-life-with-advance-option-chain-tool-AOC1-150x150.jpg)