Uncover the untapped potential within market structure breaks and revolutionize your strategies. Gain insightful wisdom from @travelbrandindia & SeoRub masterful guide to unleashing their power. 💥📈 #MarketStructure #StrategyMastery #Empowerment
You can Tweet this Quote
Discover the untold secrets of Market Structure Breaks to unlock your true potential for financial success.

Concept of market structure breaks?
Are you tired of struggling to make profitable trades in the tumultuous world of trading? Do you often find yourself at a loss when it comes to identifying potential turning points or areas of interest in the market?
Well, fear not! In this blog post, we are going to delve into the exciting realm of market structure break and order block, and how Emrekb’s approach can help you navigate the markets with confidence and precision?
Understanding Market Structure Break
Before we dive into the specifics of Emrekb’s strategy, let’s take a moment to understand the concept of market structure break. In technical analysis, market structure break refers to the instances where the price breaks key support or resistance levels, signaling a potential shift in market sentiment. These breaks can occur in various forms, such as higher highs or lower lows, and they play a crucial role in identifying trend reversals or continuations.
To effectively identify market structure breaks, it is essential to pay close attention to support and resistance levels on your chart. These levels act as barriers that the price must overcome to establish a new trend. By pinpointing these key levels and monitoring how the price reacts to them, you can gain valuable insights into the market dynamics and make informed trading decisions.
Input Settings of This indicator
These are settings that traders can configure when using the indicator. They include parameters like ZigZag length, whether to show ZigZag lines, a Fibonacci factor for breakout confirmation, and text size for labels. Users can also choose to delete old/broken boxes.

Identifying and Analyzing Order Blocks
Now, let’s turn our attention to order blocks. Order blocks, as described by Emrekb, are consolidation areas or zones on the chart where significant price activity has occurred. These blocks can be identified by examining periods of sideways movement or sharp price spikes, indicating potential supply or demand imbalances.
How ZigZag Calculation works?
The script calculates the ZigZag pattern to identify market structure highs and lows, and it determines the current trend direction.
By analyzing order blocks, traders can potentially uncover critical turning points or areas of interest in the market. These zones act as magnets for price action and often serve as crucial levels for traders to enter or exit positions. By incorporating order block analysis into your trading strategy, you can enhance your ability to find high-probability trade setups and optimize risk-reward ratios.
Emrekb’s Approach to Market Structure Break & Order Block
What sets Emrekb’s approach apart from traditional methods is his unique perspective on market dynamics and price action analysis. Emrekb emphasizes the importance of combining market structure break and order block analysis to gain a comprehensive understanding of the market’s behavior.
Way of Market Condition Calculation
It calculates the market condition based on certain conditions and Fibonacci retracement levels.
Emrekb’s methodology involves identifying key support and resistance levels, analyzing market structure breaks, and carefully examining order blocks within those structures. By honing in on these price levels and zones, Emrekb believes traders can pinpoint profitable trading opportunities with a higher degree of accuracy.
Step-by-Step Guide: Using Market Structure Break & Order Block
So, how can you put Emrekb’s approach into practice? Let’s break it down step by step:
Step 1: Identify key support and resistance levels on your chart
Start by scanning your chart for significant support and resistance levels. These can be identified using various technical tools, such as trendlines, horizontal levels, or Fibonacci retracement levels. These levels will serve as the foundation for your market structure analysis.
Step 2: Analyze the market structure to determine breaks and potential order blocks
Next, examine the market structure to identify instances where the price breaks key support or resistance levels. These breaks will indicate potential opportunities for trade entries or exits. Additionally, look for order blocks within these structures, which will provide further confirmation of potential turning points or areas of interest.
Step 3: Utilize additional indicators or tools to confirm your analysis
While market structure break and order block analysis form the core of Emrekb’s approach, it is always beneficial to supplement your analysis with other technical indicators or tools. These can include moving averages, oscillators, or volume indicators, which can provide additional insights and confirmation of your trading decisions.
Order Block Index Calculation
The script calculates the starting index of Buy and Sell Order Blocks (BU-OB and BE-OB) based on price action.
Step 4: Implement appropriate risk management strategies and entry/exit points
No trading strategy is complete without proper risk management. Determine your risk tolerance and establish appropriate entry and exit points for your trades. Set stop-loss orders to limit potential losses and consider using trailing stops or take-profit levels to lock in profits as the trade progresses.
Step 5: Monitor and evaluate your trades based on market structure and order blocks
Once your trades are in progress, it is crucial to monitor and evaluate them based on market structure and order block dynamics. Keep an eye on how the price reacts to the identified levels and zones and consider adjusting your positions or taking profits as the market evolves.
Case Studies and Examples
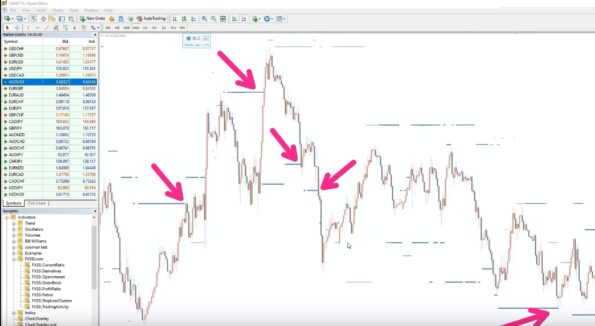
Now that we have covered the theory behind Emrekb’s approach, let’s explore some real-life examples to see it in action. Below, we present a couple of case studies showcasing market structure breaks and order blocks:
Case Study 1: Bullish Market Structure Break
In this scenario, the price breaks a key resistance level, establishing a higher high in the market structure. Within the resulting bullish structure, an order block is identified as the price consolidates before the next leg up. Traders using Emrekb’s approach could enter a long position at the breakout of the order block, anticipating further upward momentum.

Case Study 2: Bearish Market Structure Break
In this example, the price breaks a crucial support level, forming a lower low in the market structure. Within the ensuing bearish structure, an order block is identified as the price retests the broken support level before continuing downward. Traders employing Emrekb’s strategy could short the market upon the break of the order block, riding the downward momentum.
Tips and Best Practices
While Emrekb’s approach offers tremendous potential in trading, it’s important to keep a few tips and best practices in mind:
– Patience is key: Wait for clear market structure breaks and well-defined order blocks before entering trades.
– Continuously learn and adapt: Markets evolve, and so should your trading strategy. Stay updated with new concepts and techniques.
– Practice on historical data and demo accounts: Familiarize yourself with Emrekb’s method before committing real capital. Backtest and demo trade to gain confidence.
Conclusion
Mastering market structure breaks and order block analysis can significantly improve your trading accuracy and profitability. Emrekb’s unique approach adds a fresh perspective to technical analysis, enabling traders to identify potential turning points and areas of interest with greater precision.
By using this indicator, it is designed to visualize market structure changes and identify order blocks (buy and sell) on a price chart. Traders can configure various settings and receive alerts when specific market conditions are met. The indicator aims to assist traders in making trading decisions based on these visual cues and alerts.
More from my site
 Market Profile Trading Strategies: A Step-by-Step Overview
- Mastering Advance Option Chain Tool [AOC]: A Trader’s Key to Success
- Menara Trading Software: Algorithmic Trading for Professionals
- Becoming a Limitless Trader: Strategies for limitless trading Success
- Nifty Trader: A live OI, PCR, Max pain of Stock Market for Indian Investors
- Do Trading Patterns Predict Market Movements? – The Power of Patterns

![Mastering Advance Option Chain Tool [AOC]: A Trader’s Key to Success](https://seorub.com/wp-content/uploads/2023/07/A-trader-life-with-advance-option-chain-tool-AOC1-150x150.jpg)