It’s a normal questions for every trader that do trading patterns work? But we know, Trading patterns are a popular technical analysis tool used by traders to identify potential reversals or continuations in price trends. They are based on the idea that market prices tend to follow certain patterns, and that these patterns can be used to predict future price movements.
What is the Definition of trading patterns?
A trading pattern is a specific formation of price movements on a chart that traders use to identify potential reversals or continuations in price trends. They are based on the idea that market prices tend to follow certain patterns, and that these patterns can be used to predict future price movements.
There are many different types of trading patterns, but some of the most common include:
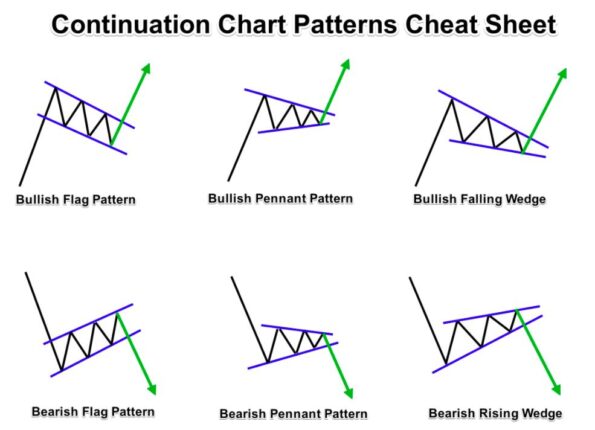
- Continuation patterns: These patterns suggest that the current trend is likely to continue. Some examples of continuation patterns include the ascending triangle, the symmetrical triangle, and the descending triangle.
- Reversal patterns: These patterns suggest that the current trend is likely to reverse. Some examples of reversal patterns include the head-and-shoulders pattern, the double bottom pattern, and the double top pattern.
- Support and resistance levels: These are price levels where buyers and sellers are likely to come into balance, resulting in a temporary pause in the price movement.

What are the Importance of understanding effectiveness of trading patterns?
The importance of understanding the effectiveness of trading patterns is that it can help traders to make more informed trading decisions. By understanding how effective different patterns are, traders can better assess the probability of success for a particular trade. This can help them to manage their risk and to maximize their profits.
There are a number of factors that can affect the effectiveness of trading patterns, including the following:
- The type of pattern. Some patterns are more effective than others. For example, reversal patterns are generally considered to be more reliable than continuation patterns.
- The time frame. The effectiveness of a pattern can vary depending on the time frame being used. For example, a pattern that is effective on a daily chart may not be effective on a weekly chart.
- The market conditions. The effectiveness of a pattern can also vary depending on the market conditions. For example, a pattern that is effective in a trending market may not be effective in a range-bound market.
It is important to note that no trading pattern is 100% reliable. However, by understanding the effectiveness of different patterns, traders can increase their chances of success.
Let’s Understanding The Trading Patterns
Trading patterns can be a valuable tool for traders, but it is important to remember that they are not always reliable. They can be invalidated by unexpected news or events, and they can also be used by other traders to manipulate the market.
Here are some of the benefits of using trading patterns:
- They can help traders to identify potential trading opportunities.
- They can help traders to manage their risk by providing them with a framework for understanding market behavior.
- They can help traders to make more informed trading decisions.
What are the common trading patterns?
Here are some of the most common trading patterns:
Continuation patterns:
These patterns suggest that the current trend is likely to continue. Some examples of continuation patterns include the ascending triangle, the symmetrical triangle, and the descending triangle.
Current trend is likely to continue.
Reversal patterns
These patterns suggest that the current trend is likely to reverse. Some examples of reversal patterns include the head-and-shoulders pattern, the double bottom pattern, and the double top pattern.

current trend is likely to reverse
Support and resistance levels
These are price levels where buyers and sellers are likely to come into balance, resulting in a temporary pause in the price movement.
Candlestick patterns
These patterns are formed by the closing, opening, high, and low prices of a security over a given period of time. Some examples of candlestick patterns include the hammer, the shooting star, and the engulfing pattern.
————————————————-
These are just a few of the most common trading patterns. There are many other patterns that traders use, and the specific patterns that are used will vary depending on the asset being traded and the time frame being used.

The Heartbreaking Truth: Why Chart Patterns Fail to Bring Profits in Trading
There are a few reasons why chart patterns are not always profitable to trade.
- Markets are unpredictable. The stock market is a complex system, and it is impossible to predict with certainty how it will move in the future. This means that even if a chart pattern has been successful in the past, there is no guarantee that it will be successful in the future.
- Chart patterns can be manipulated. Professional traders and institutions often use chart patterns to their advantage. They may enter or exit trades based on the formation of a chart pattern, which can invalidate the pattern for other traders.
- Chart patterns are not always clear. Sometimes, it can be difficult to identify a chart pattern. This is especially true when the market is volatile or when there is a lot of noise in the price data.
- Chart patterns are not the only factor to consider. When trading, it is important to consider a variety of factors, including the overall trend of the market, the news and economic data, and the technical indicators. Chart patterns can be a useful tool, but they should not be the only factor that traders consider when making trading decisions.
Despite these limitations, chart patterns can be a valuable tool for traders. By understanding the limitations of chart patterns and using them in conjunction with other technical analysis tools, traders can increase their chances of success.
Here are some additional tips for trading chart patterns:
- Use multiple patterns. No single pattern is perfect, so it is a good idea to use multiple patterns to confirm a trade.
- Use stop-losses. This will help to limit your losses if the trade goes against you.
- Don’t overtrade. It is important to be patient and only trade when you have a good setup.
- Backtest your strategies. This will help you to see how your strategies have performed in the past.
By following these tips, you can increase your chances of success when trading chart patterns.
In case, patterns works but we are not able to make profit from it, why?
There are a few reasons why you might not be able to make a profit from trading chart patterns, even if the patterns themselves are working.
You may be using the wrong patterns for the market conditions
Some patterns are more effective in certain market conditions than others. For example, reversal patterns are generally more effective in trending markets, while continuation patterns are more effective in range-bound markets.
You may be entering or exiting trades too early or too late
It is important to time your entries and exits carefully when trading chart patterns. If you enter a trade too early, you may miss out on some of the profits. If you enter a trade too late, you may already be too late to make a profit.
You may be using too large of a position size
If you are using too large of a position size, you may not be able to withstand the losses that can occur when trading chart patterns. It is important to use a position size that you are comfortable with and that will not put you at risk of losing more money than you can afford to lose.
You may be using the wrong stop-loss
A stop-loss is an order that automatically sells your position if the price reaches a certain level. It is important to use a stop-loss that will protect your profits and limit your losses.
You may be trading too often
It is important to be patient and only trade when you have a good setup. If you trade too often, you are more likely to make mistakes and lose money.
If you are not making a profit from trading chart patterns, it is important to review your trading strategy and make sure that you are not making any of the mistakes listed above. You may also want to consider using a different set of patterns or trading in a different market.
Do chart patterns work in all markets?
Chart patterns can work in all markets, but they are not always effective. The effectiveness of chart patterns can vary depending on the market conditions, the time frame being used, and the type of pattern being used.
For example, reversal patterns are generally more effective in trending markets, while continuation patterns are more effective in range-bound markets. Additionally, some patterns are more effective in shorter time frames, while others are more effective in longer time frames.
What are the most reliable chart patterns?
There is no one answer to this question, as the most reliable chart patterns can vary depending on the market conditions, the time frame being used, and the type of pattern being used. However, some of the most reliable chart patterns include:
Head and shoulders pattern
This is a reversal pattern that is formed when the price of an asset forms three peaks, with the middle peak being the highest. The head and shoulders pattern is often seen as a sign that the trend is about to reverse.
Double bottom pattern
This is a reversal pattern that is formed when the price of an asset forms two troughs, with the second trough being lower than the first. The double bottom pattern is often seen as a sign that the trend is about to reverse.
Ascending triangle pattern
This is a continuation pattern that is formed when the price of an asset forms a series of higher lows and lower highs. The ascending triangle pattern is often seen as a sign that the trend is likely to continue.
However, by understanding the limitations of chart patterns and using them in conjunction with other technical analysis tools, traders can increase their chances of success.
trading #patterns #technicalanalysis #marketmovements #success #guide
More from my site
 Market Profile Trading Strategies: A Step-by-Step Overview
- Mastering Advance Option Chain Tool [AOC]: A Trader’s Key to Success
- Menara Trading Software: Algorithmic Trading for Professionals
- Becoming a Limitless Trader: Strategies for limitless trading Success
- How to use market structure break & order block by emrekb?
- Nifty Trader: A live OI, PCR, Max pain of Stock Market for Indian Investors

![Mastering Advance Option Chain Tool [AOC]: A Trader’s Key to Success](https://seorub.com/wp-content/uploads/2023/07/A-trader-life-with-advance-option-chain-tool-AOC1-150x150.jpg)