In the world of online trading, the Relative Strength Index or RSI is a popular technical indicator that can help traders to identify potential buy and sell signals in the market. With the availability of Tradingview, a popular online trading platform, traders can easily access RSI charts and use various trading strategies to make profitable trades.
In this article, we will discuss some effective RSI trading strategies for Tradingview that can help traders to achieve their financial goals.
Understanding RSI
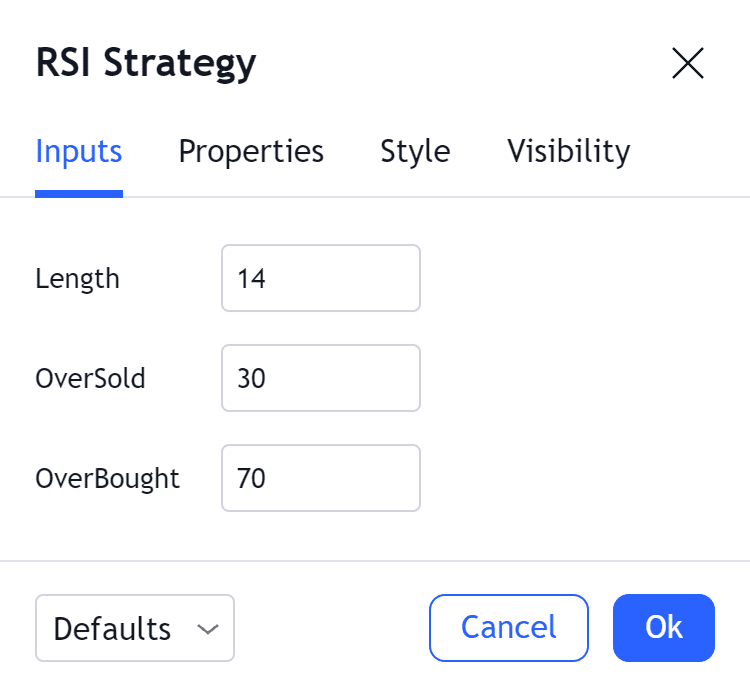
Before we dive into the RSI trading strategies, it is important to understand what RSI is and how it works. RSI is a momentum oscillator that measures the speed and change of price movements in a particular security. It is calculated using the average gains and losses of a security over a specified period of time. The RSI indicator typically oscillates between 0 and 100, with readings above 70 considered overbought and readings below 30 considered oversold.
Strategy 1: RSI Divergence
One of the most popular RSI trading strategies is RSI divergence. This strategy involves looking for divergences between the RSI indicator and price movements in the market. A bullish divergence occurs when the RSI is making higher lows while the price is making lower lows, indicating that the trend may be reversing. A bearish divergence occurs when the RSI is making lower highs while the price is making higher highs, indicating that the trend may be reversing.
Strategy 2: RSI Overbought/Oversold
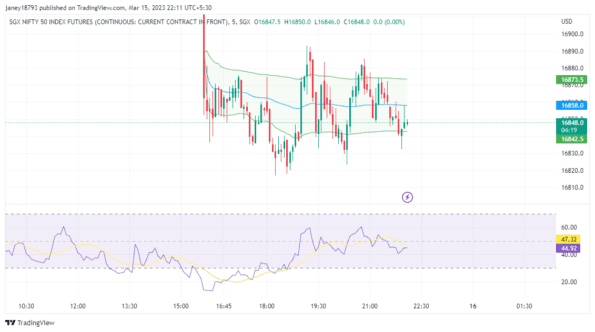
Another popular RSI trading strategy is to use the overbought and oversold levels of the RSI indicator. When the RSI rises above 70, it is considered overbought, and when it falls below 30, it is considered oversold. Traders can use these levels to identify potential buy and sell signals. For example, when the RSI falls below 30, it may indicate that the security is oversold and that a potential buying opportunity may exist.
Strategy 3: RSI Trendline Break
The RSI trendline break strategy involves drawing trendlines on the RSI indicator and looking for breaks of these trendlines. When the RSI breaks above a trendline, it may indicate that the security is gaining momentum and that a potential buying opportunity may exist. Conversely, when the RSI breaks below a trendline, it may indicate that the security is losing momentum and that a potential selling opportunity may exist.
Strategy 4: RSI Moving Average
The RSI moving average strategy involves using a moving average of the RSI indicator to identify potential buy and sell signals. When the RSI crosses above its moving average, it may indicate a potential buying opportunity, while when it crosses below its moving average, it may indicate a potential selling opportunity.
Conclusion
In conclusion, RSI is a powerful technical indicator that can help traders to identify potential buy and sell signals in the market. By using the RSI trading strategies discussed in this article, traders can improve their chances of making profitable trades on Tradingview.
However, it is important to remember that no trading strategy is foolproof and that traders should always conduct thorough research and analysis before making any trades.
Pointers to get in fastest way
- Introduction:
- RSI is a popular technical indicator for identifying potential buy and sell signals in the market.
- Tradingview platform allows easy access to RSI charts and various trading strategies.
- In this article, we will discuss effective RSI trading strategies for Tradingview.
- Understanding RSI:
- RSI is a momentum oscillator that measures the speed and change of price movements in a security.
- It is calculated using the average gains and losses of a security over a specified period of time.
- RSI readings above 70 are considered overbought and below 30 are considered oversold.
- Strategy 1: RSI Divergence:
- This strategy involves looking for divergences between the RSI and price movements.
- Bullish divergence occurs when price makes lower lows while RSI makes higher lows, indicating a potential upward trend.
- Bearish divergence occurs when price makes higher highs while RSI makes lower highs, indicating a potential downward trend.
- Strategy 2: RSI Overbought/Oversold:
- This strategy involves buying when the RSI is oversold and selling when it is overbought.
- For example, if the RSI of a security drops below 30, it may be considered oversold and a potential buying opportunity.
- Conversely, if the RSI of a security rises above 70, it may be considered overbought and a potential selling opportunity.
- Strategy 3: RSI Trendline Breakout:
- This strategy involves drawing trendlines on the RSI chart and looking for breakouts.
- When the RSI breaks above a downward trendline or below an upward trendline, it may indicate a potential trend reversal.
- Traders can use this strategy to enter or exit positions based on the RSI trendline breakouts.
- Conclusion:
- RSI trading strategies can be effective in identifying potential buy and sell signals in the market.
- Traders should be cautious and use risk management techniques while implementing these strategies.
- By understanding and utilizing these RSI trading strategies, traders can make more informed trading decisions on Tradingview.
More from my site
 10 Best Stock Market Trading Books of All Time
- Grindwell Norton Share Price Live (2,093.00 INR): Investors Analysis
- Master the Art of Trading: Unlocking the Secrets of Volume Profiling
- Market Profile Trading Strategies: A Step-by-Step Overview
- Mastering Advance Option Chain Tool [AOC]: A Trader’s Key to Success
- How to Use Trailing Stop Loss in Zerodha? | Zerodha Mein SL (Stop Loss) Order Kaise Lagate Hai?


![Mastering Advance Option Chain Tool [AOC]: A Trader’s Key to Success](https://seorub.com/wp-content/uploads/2023/07/A-trader-life-with-advance-option-chain-tool-AOC1-150x150.jpg)